--------------------
DIA 13
IBM 14.27
CVX 11.49
CAT 26.47
MMM 16.55
XOM 13.79
UTX 18.01
MCD 16.60
BA 16.68
JNJ 12.44
--------------------
SPY 14
XOM 13.79
AAPL 18.86
GE 19.16
CVX 11.49
IBM 14.27
MSFT 11.18
BAC
T 9.12
JPM 11.97
PG 16.93
XLB 14
XLU 13
XLF 13
XLV 12
XLI 16
XLP 14
XLK 15
XLE 15
XLY 15
--------------------
QQQ 17
AAPL 18.86
QCOM 24.53
GOOG 22.04
MSFT 11.18
ORCL 22.35
AMZN 73.09
INTC 9.97
TEVA 13.86
CMCSA 19.10
GILD 12.50
----------------------
Thursday, April 7, 2011
Monday, April 4, 2011
Predicting the Future of S&P 500
Let's take a look at S&P 500 (SPX) from 1964 though 2011.

It is obvious that it is confined within 800 and 1,500 for the last 10 years.
Here is the 10 year view:

5 year view:

4 year view:

3 year view:

2 year view

and 1 year veiw:

==================================================
Whenever it is above the 400 moving average (blue line), it is in the up trend. When it is under the blue line, it is in down trend.
Now, let's see if we can use the 400-200 SMA (Simple Moving Average) to avoid the bear market.
First, take a look at the first market cycle: 1/1/1964 -- 12/31/1974:

It has 3 bull-bear pairs. Each of them lasts about 3 years.
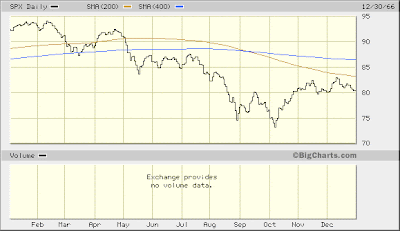
Let's take a look at the first bear in 1966 [(87-94)/94=-7.4%]:
The second bear in 1969 [ (98-106)/106=-7.54%]:

The third bear in 1973 [(105-120)/120=-12.5%]:

The next market cycle is from 1975 to 1982:


In these 8 years, there are 2 obvious bears: 1977 and 1981; 1 fuzzy bear.
First bear in 1977 [(98-108)/108=-9%]:
1981:
Second bear in 1982:

Next big market cycle happens from 1982 to 2000:

Or, Next big market cycle happens from 1984 to 1994:

This is a very big bull with 3 small bears in it:
1987 bear [(240-330)/330=-27%]:

1990 bear [(315-360)/360=-12,5%]:

1994 bear [(440-480)/480=-8.3%]

The next big market cycle is from 1995 to 2000. There is no obvious bears. With only small bears in each year:
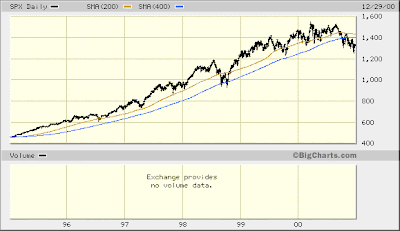
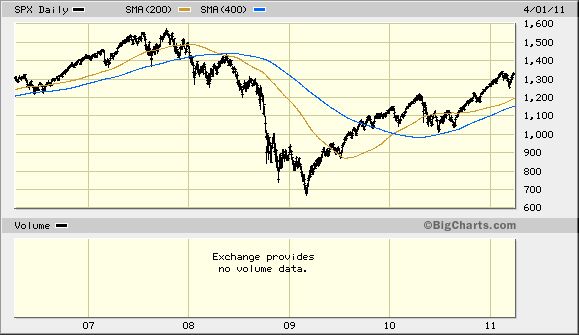
The most recent market cycle 2000 -- ?
2000 bear [(1350-1500)/1500=-10%]
2007/8 bear [(1350-1500)/1500=-10%]

or 1995 -- ??

Summary of Market Cycles
64 - 75 75 -- 65 11 yrs Bear
75 - 82 70 -- 110 7 yrs Smal bull
82 - 00 120 -- 1200 18 yrs Big bull
00 - ?? 1400 -- 1200 11 yrs Bear
-----------------------------------------


Next.

It is obvious that it is confined within 800 and 1,500 for the last 10 years.
Here is the 10 year view:

5 year view:
4 year view:

3 year view:

2 year view

and 1 year veiw:

==================================================
Whenever it is above the 400 moving average (blue line), it is in the up trend. When it is under the blue line, it is in down trend.
Now, let's see if we can use the 400-200 SMA (Simple Moving Average) to avoid the bear market.
First, take a look at the first market cycle: 1/1/1964 -- 12/31/1974:

It has 3 bull-bear pairs. Each of them lasts about 3 years.
Let's take a look at the first bear in 1966 [(87-94)/94=-7.4%]:

The second bear in 1969 [ (98-106)/106=-7.54%]:

The third bear in 1973 [(105-120)/120=-12.5%]:

The next market cycle is from 1975 to 1982:


In these 8 years, there are 2 obvious bears: 1977 and 1981; 1 fuzzy bear.
First bear in 1977 [(98-108)/108=-9%]:

1981:
Second bear in 1982:

Next big market cycle happens from 1982 to 2000:

Or, Next big market cycle happens from 1984 to 1994:

This is a very big bull with 3 small bears in it:
1987 bear [(240-330)/330=-27%]:

1990 bear [(315-360)/360=-12,5%]:

1994 bear [(440-480)/480=-8.3%]

The next big market cycle is from 1995 to 2000. There is no obvious bears. With only small bears in each year:

The most recent market cycle 2000 -- ?
2000 bear [(1350-1500)/1500=-10%]
2007/8 bear [(1350-1500)/1500=-10%]

or 1995 -- ??

Summary of Market Cycles
-----------------------------------------
Time Prices Years Type
-----------------------------------------
49 - 63 xx -- xx xx yrs Big bullTime Prices Years Type
-----------------------------------------
64 - 75 75 -- 65 11 yrs Bear
75 - 82 70 -- 110 7 yrs Smal bull
82 - 00 120 -- 1200 18 yrs Big bull
00 - ?? 1400 -- 1200 11 yrs Bear
-----------------------------------------


Next.
Monday, March 28, 2011
Investment Related Websites
https://www.borntosell.com/portfolio
http://www.888options.com/resources/covered_call_calculator.jsp
http://www.etfcoveredcalls.com/covered-call-walkthrough/
http://coveredwriter.blogspot.com/
http://www.mymoneyblog.com/
Covered Call Candidates:
QLD, SQQQ
TQQQ -- SQQQ
QQQ -- QID,
XLK, IYZ
http://www.888options.com/resources/covered_call_calculator.jsp
http://www.etfcoveredcalls.com/covered-call-walkthrough/
http://coveredwriter.blogspot.com/
http://www.mymoneyblog.com/
Covered Call Candidates:
QLD, SQQQ
TQQQ -- SQQQ
QQQ -- QID,
XLK, IYZ
Sunday, March 27, 2011
US Equity History YTD (1st Quarter)
US Equity History YTD (1st Quarter) along with major events:

Japan ETF -- EWJ


=======================================
Five Myths About Asset Allocation
Richard A. Ferri, 06.11.10, 11:00 AM EDT
Forbes Magazine dated June 28, 2010
There is no perfect allocation and no absolute protection in a bear market. But it's still worth diversifying and rebalancing once a year.
Myth 1: Asset allocation protects you from the bear.
Myth 2: Tactical allocation is best in volatile markets.
Myth 3: There is an optimal strategic asset allocation.
Myth 4: Constant rebalancing is needed.
Myth 5: More funds equals more diversification.
========================================
http://www.bloomberg.com/markets/economic-calendar/
http://www.etfsecurities.com/us/securities/etfs_securities.asp
Perfect Portfolios: Updated
http://www.smartmoney.com/investing/stocks/the-perfect-portfolio-1294688341486/
http://online.wsj.com/public/quotes/browse_etfs.html
http://blogs.barrons.com/focusonfunds/?mod=BOL_other_tnav_blogs
Expected Retirement Account Acrument
| Current fund Amount: $260,000.00 | ||
|---|---|---|
| Total fund Amount: | $1,377,230.04 | |
| Interest: | 6% | |
| Annual contribution: | $24,000.00 | |
| Age to reach your goal: | 65 | |
| Fund Values for the Next 17 Years | ||
|---|---|---|
| Year | Total Annual Contribution | Total Fund Value |
| 1 | 24,000.00 | 299,600.00 |
| 2 | 48,000.00 | 341,576.00 |
| 3 | 72,000.00 | 386,070.56 |
| 4 | 96,000.00 | 433,234.79 |
| 5 | 120,000.00 | 483,228.88 |
| 6 | 144,000.00 | 536,222.61 |
| 7 | 168,000.00 | 592,395.97 |
| 8 | 192,000.00 | 651,939.73 |
| 9 | 216,000.00 | 715,056.11 |
| 10 | 240,000.00 | 781,959.48 |
| 11 | 264,000.00 | 852,877.05 |
| 12 | 288,000.00 | 928,049.67 |
| 13 | 312,000.00 | 1,007,732.65 |
| 14 | 336,000.00 | 1,092,196.61 |
| 15 | 360,000.00 | 1,181,728.41 |
| 16 | 384,000.00 | 1,276,632.11 |
| 17 | 408,000.00 | 1,377,230.04 |
Friday, March 25, 2011
First Covered Call in 2011
1. Look at the 1 Yr Stock Chart for QLD. It looks like a chance to do covered call -- It has fallen from its Feburary high and started to rebound. Optimistically, there is chance it will bounce back to its Feburary high of $95.35. The stock is not at around $89. From $89 to $95, it is of ($95-$89)/$89=6.7% increase.

2. Take a look at the Option Chain for option expiring on July 16. The bid and ask prices of the $89 call are $7.3 and $7.8 respectively. Conservatively, there is possibility of maximum return of $7.3/$89=8.2% within about 4 months.

3.To calculate the "Premium" of the "Net Debit",
Premium = Bid Price of the Underlying Stock - Ask Price of the Call Option
= $89.23 - $7.85 + $0.05 = $81.38 + $0.05 = $81.43
Here is the order:

Here is the Review of the Order before submission:

4. Here is the Order Status before its being filled:

5. Here is the Order Status when it is filled:

Here is the History page after the order is filled:


Price bought = $88.94
Premium received = $7.51
Total Cost = $88.94 * 100 + 20 = 8910$
----------------------------------------
Balance Before Covered Call Trading:
Cash balance $0.00
Money market $10,841.80
Long stock value $3,386.56 (QLD= 89.12$/share * 38 shares)
------------------------------------------------------------------------
Account value $14,228.36
Balance After Covered Call Trading:
Cash balance $0.00
Money market $2688.04 $10,841.80-$8143-$10.76
Long stock value $12,273.72 (QLD= 88.17$/share * 138 shares)
Short Stock Value -$750 ($7.5 * 100 = $750)
------------------------------------------------------------
Account value $14,105.5
Cash balance $0.00
Money market $10,841.80
Long stock value $3,386.56 (QLD= 89.12$/share * 38 shares)
------------------------------------------------------------------------
Account value $14,228.36
Balance After Covered Call Trading:
Cash balance $0.00
Money market $2688.04 $10,841.80-$8143-$10.76
Long stock value $12,273.72 (QLD= 88.17$/share * 138 shares)
Short Stock Value -$750 ($7.5 * 100 = $750)
------------------------------------------------------------
Account value $14,105.5
7. Let's see what we will get as maximum possible gain and loss:
7.1 Maxium Possible Gain:
Final Banlance = ($88.94+$7.51)x100 = $96.45x100 = $9645
Total Rate of Return (TRR) = ($9645-$8910)/$8910 = 8.24%
Final Balance = 138x$96.45 + $2688.04 - $11 = $15,987.14
7.2 "Reasonable" Possible Loss:
Final Balance = ($70+$7.51)x100 = $77.51x100 = $7751
Total Rate of Return (TRR) = ($7751-$8910)/$8910$
= -$1159/$8910 = -13.00%
If this happens, I will buy $750 worth of QLD, that will be
$750/($70/share) = 10 shares.
Final Balance = 138x$70.00 + $2688.04 = $12,348.04.
Let's see if we will end up at $15,987.14 or $12,348.04. Most likely it will be at somewhere in between.
Here is the QLD option quote expiring July 16, 2011:
http://finance.yahoo.com/q/os?s=QLD&m=2011-07-15
Here is the QLD option quote expiring July 16, 2011:
http://finance.yahoo.com/q/os?s=QLD&m=2011-07-15
8. Prediction of Best and Worst Cases in 5 Years:
Best Case:
4 Months: 8%;
12 Months: 1.08^3 = 1.259 ==> 25.9% anually
5 Yrs: 1.2^5 = 2.488
$14,000 ==> $8910 x 2.48 = $34,832 in 5 years.
Worst Case:
The stock will go to $30/share
10 shares bought whenever it drops 20$, so, 30 shares to be bought
Total Values (38+100+30)shares * 30$/share + $2500 cash
= $5040+ $2500=$7540.
TRR = (7540-14,000) / 14,000 = -6460/14000 = -46%
However, it reaches to $70, the portfolio will become:
168*70$ + 2500$ = 11,760$ + 2500$ = 14,260$
Subscribe to:
Posts (Atom)