--------------------
DIA 13
IBM 14.27
CVX 11.49
CAT 26.47
MMM 16.55
XOM 13.79
UTX 18.01
MCD 16.60
BA 16.68
JNJ 12.44
--------------------
SPY 14
XOM 13.79
AAPL 18.86
GE 19.16
CVX 11.49
IBM 14.27
MSFT 11.18
BAC
T 9.12
JPM 11.97
PG 16.93
XLB 14
XLU 13
XLF 13
XLV 12
XLI 16
XLP 14
XLK 15
XLE 15
XLY 15
--------------------
QQQ 17
AAPL 18.86
QCOM 24.53
GOOG 22.04
MSFT 11.18
ORCL 22.35
AMZN 73.09
INTC 9.97
TEVA 13.86
CMCSA 19.10
GILD 12.50
----------------------
Thursday, April 7, 2011
Monday, April 4, 2011
Predicting the Future of S&P 500
Let's take a look at S&P 500 (SPX) from 1964 though 2011.

It is obvious that it is confined within 800 and 1,500 for the last 10 years.
Here is the 10 year view:

5 year view:

4 year view:

3 year view:

2 year view

and 1 year veiw:

==================================================
Whenever it is above the 400 moving average (blue line), it is in the up trend. When it is under the blue line, it is in down trend.
Now, let's see if we can use the 400-200 SMA (Simple Moving Average) to avoid the bear market.
First, take a look at the first market cycle: 1/1/1964 -- 12/31/1974:

It has 3 bull-bear pairs. Each of them lasts about 3 years.
Let's take a look at the first bear in 1966 [(87-94)/94=-7.4%]:
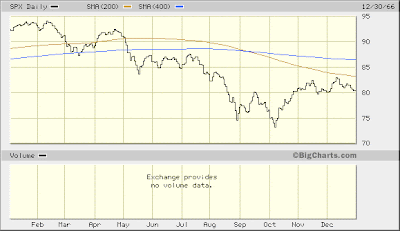
The second bear in 1969 [ (98-106)/106=-7.54%]:

The third bear in 1973 [(105-120)/120=-12.5%]:

The next market cycle is from 1975 to 1982:


In these 8 years, there are 2 obvious bears: 1977 and 1981; 1 fuzzy bear.
First bear in 1977 [(98-108)/108=-9%]:
1981:
Second bear in 1982:

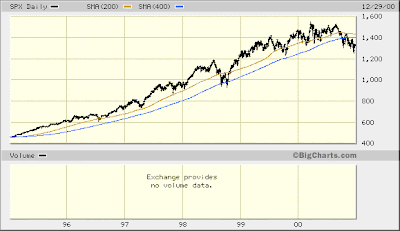
Next big market cycle happens from 1982 to 2000:

Or, Next big market cycle happens from 1984 to 1994:

This is a very big bull with 3 small bears in it:
1987 bear [(240-330)/330=-27%]:

1990 bear [(315-360)/360=-12,5%]:

1994 bear [(440-480)/480=-8.3%]

The next big market cycle is from 1995 to 2000. There is no obvious bears. With only small bears in each year:
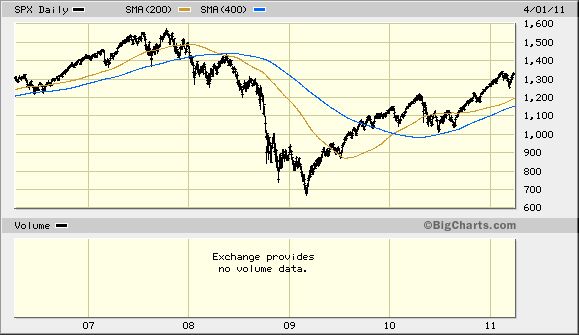
The most recent market cycle 2000 -- ?
2000 bear [(1350-1500)/1500=-10%]
2007/8 bear [(1350-1500)/1500=-10%]

or 1995 -- ??

Summary of Market Cycles
64 - 75 75 -- 65 11 yrs Bear
75 - 82 70 -- 110 7 yrs Smal bull
82 - 00 120 -- 1200 18 yrs Big bull
00 - ?? 1400 -- 1200 11 yrs Bear
-----------------------------------------


Next.

It is obvious that it is confined within 800 and 1,500 for the last 10 years.
Here is the 10 year view:

5 year view:
4 year view:

3 year view:

2 year view

and 1 year veiw:

==================================================
Whenever it is above the 400 moving average (blue line), it is in the up trend. When it is under the blue line, it is in down trend.
Now, let's see if we can use the 400-200 SMA (Simple Moving Average) to avoid the bear market.
First, take a look at the first market cycle: 1/1/1964 -- 12/31/1974:

It has 3 bull-bear pairs. Each of them lasts about 3 years.
Let's take a look at the first bear in 1966 [(87-94)/94=-7.4%]:

The second bear in 1969 [ (98-106)/106=-7.54%]:

The third bear in 1973 [(105-120)/120=-12.5%]:

The next market cycle is from 1975 to 1982:


In these 8 years, there are 2 obvious bears: 1977 and 1981; 1 fuzzy bear.
First bear in 1977 [(98-108)/108=-9%]:

1981:
Second bear in 1982:

Next big market cycle happens from 1982 to 2000:

Or, Next big market cycle happens from 1984 to 1994:

This is a very big bull with 3 small bears in it:
1987 bear [(240-330)/330=-27%]:

1990 bear [(315-360)/360=-12,5%]:

1994 bear [(440-480)/480=-8.3%]

The next big market cycle is from 1995 to 2000. There is no obvious bears. With only small bears in each year:

The most recent market cycle 2000 -- ?
2000 bear [(1350-1500)/1500=-10%]
2007/8 bear [(1350-1500)/1500=-10%]

or 1995 -- ??

Summary of Market Cycles
-----------------------------------------
Time Prices Years Type
-----------------------------------------
49 - 63 xx -- xx xx yrs Big bullTime Prices Years Type
-----------------------------------------
64 - 75 75 -- 65 11 yrs Bear
75 - 82 70 -- 110 7 yrs Smal bull
82 - 00 120 -- 1200 18 yrs Big bull
00 - ?? 1400 -- 1200 11 yrs Bear
-----------------------------------------


Next.
Subscribe to:
Posts (Atom)