https://www.borntosell.com/portfolio
http://www.888options.com/resources/covered_call_calculator.jsp
http://www.etfcoveredcalls.com/covered-call-walkthrough/
http://coveredwriter.blogspot.com/
http://www.mymoneyblog.com/
Covered Call Candidates:
QLD, SQQQ
TQQQ -- SQQQ
QQQ -- QID,
XLK, IYZ
Monday, March 28, 2011
Sunday, March 27, 2011
US Equity History YTD (1st Quarter)
US Equity History YTD (1st Quarter) along with major events:
Japan ETF -- EWJ
=======================================
Five Myths About Asset Allocation
Richard A. Ferri, 06.11.10, 11:00 AM EDT
Forbes Magazine dated June 28, 2010
There is no perfect allocation and no absolute protection in a bear market. But it's still worth diversifying and rebalancing once a year.
Myth 1: Asset allocation protects you from the bear.
Myth 2: Tactical allocation is best in volatile markets.
Myth 3: There is an optimal strategic asset allocation.
Myth 4: Constant rebalancing is needed.
Myth 5: More funds equals more diversification.
========================================
http://www.bloomberg.com/markets/economic-calendar/
http://www.etfsecurities.com/us/securities/etfs_securities.asp
Perfect Portfolios: Updated
http://www.smartmoney.com/investing/stocks/the-perfect-portfolio-1294688341486/
http://online.wsj.com/public/quotes/browse_etfs.html
http://blogs.barrons.com/focusonfunds/?mod=BOL_other_tnav_blogs
Expected Retirement Account Acrument
| Current fund Amount: $260,000.00 | ||
|---|---|---|
| Total fund Amount: | $1,377,230.04 | |
| Interest: | 6% | |
| Annual contribution: | $24,000.00 | |
| Age to reach your goal: | 65 | |
| Fund Values for the Next 17 Years | ||
|---|---|---|
| Year | Total Annual Contribution | Total Fund Value |
| 1 | 24,000.00 | 299,600.00 |
| 2 | 48,000.00 | 341,576.00 |
| 3 | 72,000.00 | 386,070.56 |
| 4 | 96,000.00 | 433,234.79 |
| 5 | 120,000.00 | 483,228.88 |
| 6 | 144,000.00 | 536,222.61 |
| 7 | 168,000.00 | 592,395.97 |
| 8 | 192,000.00 | 651,939.73 |
| 9 | 216,000.00 | 715,056.11 |
| 10 | 240,000.00 | 781,959.48 |
| 11 | 264,000.00 | 852,877.05 |
| 12 | 288,000.00 | 928,049.67 |
| 13 | 312,000.00 | 1,007,732.65 |
| 14 | 336,000.00 | 1,092,196.61 |
| 15 | 360,000.00 | 1,181,728.41 |
| 16 | 384,000.00 | 1,276,632.11 |
| 17 | 408,000.00 | 1,377,230.04 |
©2011 Bloomberg L.P. All rights reserved.
Friday, March 25, 2011
First Covered Call in 2011
1. Look at the 1 Yr Stock Chart for QLD. It looks like a chance to do covered call -- It has fallen from its Feburary high and started to rebound. Optimistically, there is chance it will bounce back to its Feburary high of $95.35. The stock is not at around $89. From $89 to $95, it is of ($95-$89)/$89=6.7% increase.
2. Take a look at the Option Chain for option expiring on July 16. The bid and ask prices of the $89 call are $7.3 and $7.8 respectively. Conservatively, there is possibility of maximum return of $7.3/$89=8.2% within about 4 months.
3.To calculate the "Premium" of the "Net Debit",
Premium = Bid Price of the Underlying Stock - Ask Price of the Call Option
= $89.23 - $7.85 + $0.05 = $81.38 + $0.05 = $81.43
Here is the order:
Here is the Review of the Order before submission:
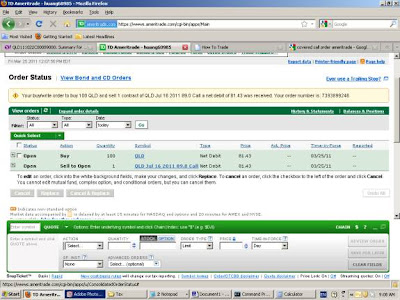
4. Here is the Order Status before its being filled:
5. Here is the Order Status when it is filled:
Here is the History page after the order is filled:

Price bought = $88.94
Premium received = $7.51
Total Cost = $88.94 * 100 + 20 = 8910$
----------------------------------------
Balance Before Covered Call Trading:
Cash balance $0.00
Money market $10,841.80
Long stock value $3,386.56 (QLD= 89.12$/share * 38 shares)
------------------------------------------------------------------------
Account value $14,228.36
Balance After Covered Call Trading:
Cash balance $0.00
Money market $2688.04 $10,841.80-$8143-$10.76
Long stock value $12,273.72 (QLD= 88.17$/share * 138 shares)
Short Stock Value -$750 ($7.5 * 100 = $750)
------------------------------------------------------------
Account value $14,105.5
Cash balance $0.00
Money market $10,841.80
Long stock value $3,386.56 (QLD= 89.12$/share * 38 shares)
------------------------------------------------------------------------
Account value $14,228.36
Balance After Covered Call Trading:
Cash balance $0.00
Money market $2688.04 $10,841.80-$8143-$10.76
Long stock value $12,273.72 (QLD= 88.17$/share * 138 shares)
Short Stock Value -$750 ($7.5 * 100 = $750)
------------------------------------------------------------
Account value $14,105.5
7. Let's see what we will get as maximum possible gain and loss:
7.1 Maxium Possible Gain:
Final Banlance = ($88.94+$7.51)x100 = $96.45x100 = $9645
Total Rate of Return (TRR) = ($9645-$8910)/$8910 = 8.24%
Final Balance = 138x$96.45 + $2688.04 - $11 = $15,987.14
7.2 "Reasonable" Possible Loss:
Final Balance = ($70+$7.51)x100 = $77.51x100 = $7751
Total Rate of Return (TRR) = ($7751-$8910)/$8910$
= -$1159/$8910 = -13.00%
If this happens, I will buy $750 worth of QLD, that will be
$750/($70/share) = 10 shares.
Final Balance = 138x$70.00 + $2688.04 = $12,348.04.
Let's see if we will end up at $15,987.14 or $12,348.04. Most likely it will be at somewhere in between.
Here is the QLD option quote expiring July 16, 2011:
http://finance.yahoo.com/q/os?s=QLD&m=2011-07-15
Here is the QLD option quote expiring July 16, 2011:
http://finance.yahoo.com/q/os?s=QLD&m=2011-07-15
8. Prediction of Best and Worst Cases in 5 Years:
Best Case:
4 Months: 8%;
12 Months: 1.08^3 = 1.259 ==> 25.9% anually
5 Yrs: 1.2^5 = 2.488
$14,000 ==> $8910 x 2.48 = $34,832 in 5 years.
Worst Case:
The stock will go to $30/share
10 shares bought whenever it drops 20$, so, 30 shares to be bought
Total Values (38+100+30)shares * 30$/share + $2500 cash
= $5040+ $2500=$7540.
TRR = (7540-14,000) / 14,000 = -6460/14000 = -46%
However, it reaches to $70, the portfolio will become:
168*70$ + 2500$ = 11,760$ + 2500$ = 14,260$
Subscribe to:
Comments (Atom)


